
A Statistical Breakdown of the New York Knicks’ Championship Run
The New York Knicks are NBA champions once again.
Twenty-seven years since their last trip to the NBA Finals. Fifty-three years since they last won it.
For generations of Knicks fans, it felt like a title might never come. The franchise endured decades of heartbreak, disappointment, and rebuilding seasons, constantly searching for a way back to basketball’s biggest stage. Now, the wait is finally over.
New York completed its championship journey with a 94–90 victory over the San Antonio Spurs in Game 5 of the NBA Finals, capturing the Larry O’Brien Trophy and putting the finishing touches on one of the most remarkable postseason runs in recent memory.
Along the way, the Knicks won 13 consecutive playoff games—the second-longest postseason winning streak in NBA history—and staged the largest comeback ever seen in the Finals.
But this championship wasn’t built on memorable moments alone.
Behind the celebrations, clutch shots, and highlight plays was a team that consistently controlled games on both ends of the floor. The numbers reveal a story of dominance, discipline, and a roster that repeatedly found ways to overwhelm opponents.
This analysis takes a closer look at the statistics behind New York’s title run, exploring not just that the Knicks won, but how they did it.
Best Championship Run Ever?
The Knicks didn’t just win games during their championship run—they dominated them.
New York finished the postseason with a +15.5 net rating, the best mark of any playoff team. In simple terms, the Knicks outscored opponents by 15.5 points per 100 possessions whenever they were on the floor. For comparison, the Spurs ranked second at +7.6—a sizable gap that highlights just how far ahead New York was from the rest of the field.
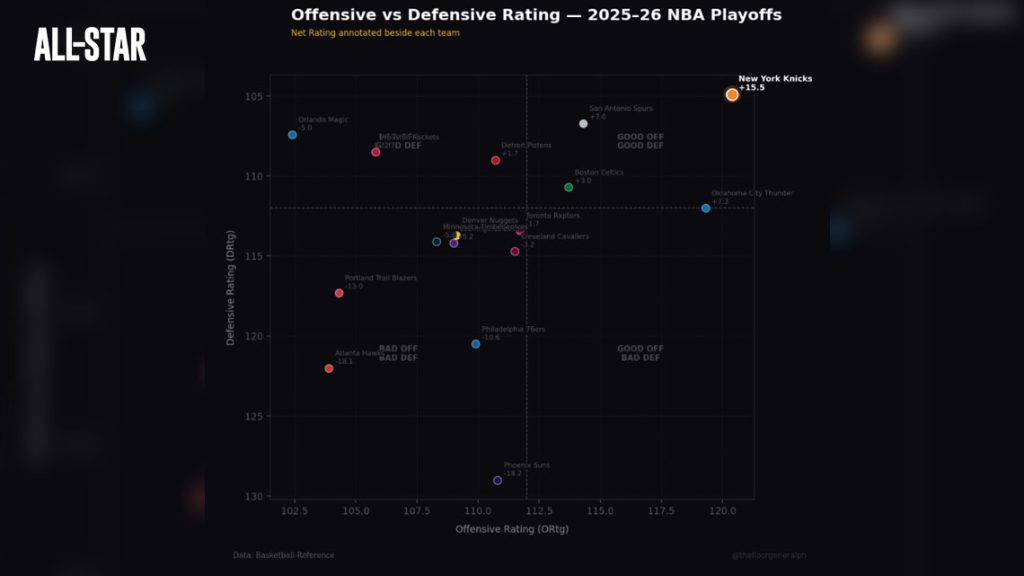
Net rating is calculated by subtracting a team’s defensive rating from its offensive rating. The Knicks didn’t just lead the playoffs in net rating—they ranked first in both offensive and defensive rating, making them the most effective team on both sides of the ball.
But it gets even crazier.
Their championship run isn’t just impressive by this season’s standards. In fact, the Knicks produced the highest net rating by a championship team in NBA history.
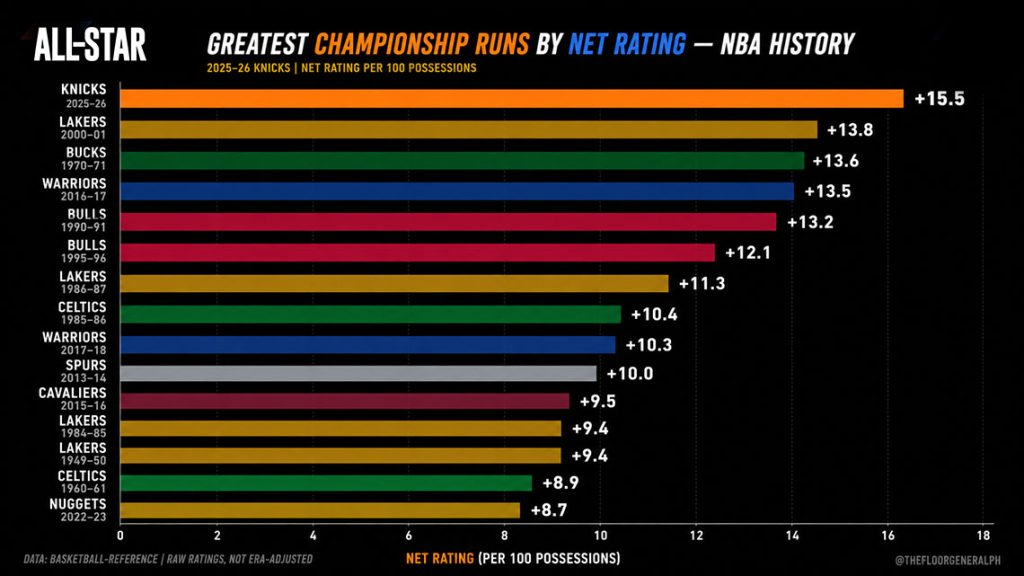
The Knicks etched their names above some of the greatest teams the league has ever seen, joining the company of legends such as Shaquille O’Neal and Kobe Bryant’s 2000–01 Lakers, the dominant 2016–17 Warriors, and Michael Jordan’s championship Bulls teams of 1990–91 and 1995–96.
This level of dominance fueled the Knicks’ +14.9 point differential per game—the highest ever recorded during a single championship run.
That performance showed up repeatedly throughout the playoffs. Three of the five largest postseason victories in franchise history came during this championship run, including a first-round closeout against the Atlanta Hawks in which New York built a stunning 51-point lead.
Whether this was the greatest championship run ever is ultimately a matter of perspective. What isn’t debatable is that the Knicks consistently produced results rarely seen in NBA history.
The next question is obvious: how did they do it?
What Makes Them Great?
At first glance, the Knicks’ staggering average point differential on their path to basketball immortality might suggest they simply overwhelmed opponents by playing fast.
But that wasn’t the case.
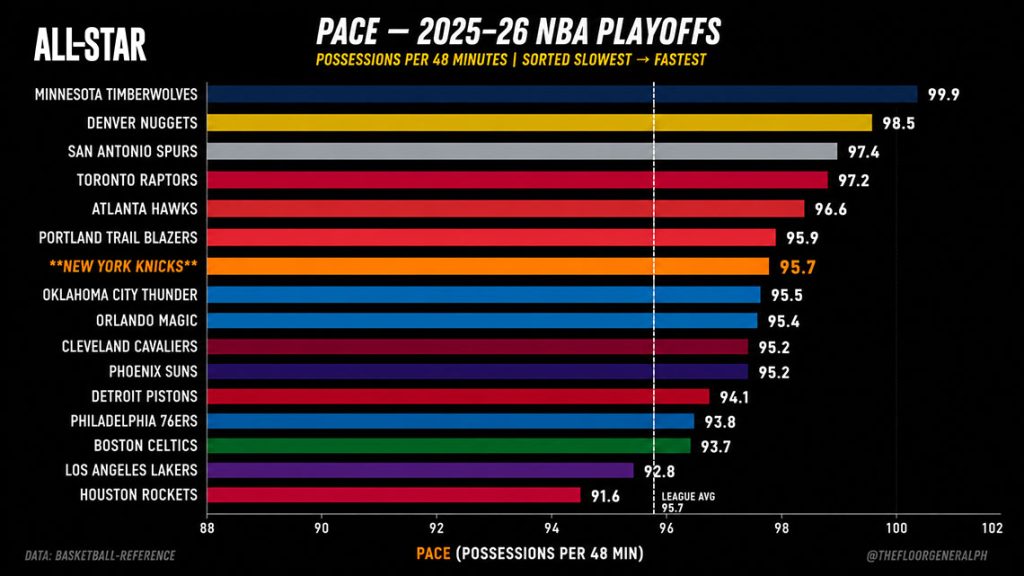
Despite their dominance, the Knicks played at a league-average pace. They didn’t win by creating more possessions than everyone else. They won by making the most of the possessions that they had.
In other words, the Knicks’ success was built not on volume, but on efficiency.
To understand just how efficient the Knicks were, the ‘Four Factors’ framework provides a useful look into it.
Created by Dean Oliver, the model identifies four areas that drive winning basketball: shooting, turnovers, rebounding, and free throws.
Those four pillars are measured through Effective Field Goal Percentage (eFG%), Turnover Percentage (TOV%), Offensive and Defensive Rebound Percentage (ORB% and DRB%), and Free Throw Rate (FTRate).
First, eFG% captures shooting efficiency while accounting for the added value of three-point shots. In simple terms, it tells you how efficiently a team scores when it gets a shot up.
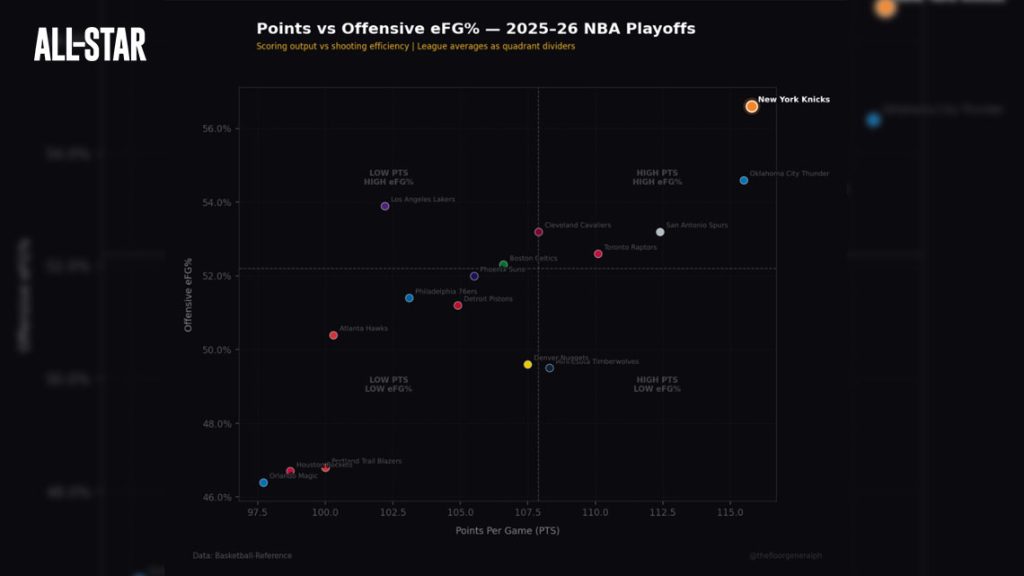
Shooting at 57 eFG%, the Knicks didn’t just lead in that category—they also paired that efficiency with production at the highest level, averaging 115.8 points per game.
What stands out is the combination. They weren’t just shooting better than everyone else; they were turning that efficiency into consistent, high-volume scoring without needing extra possessions to do it.
What makes it more impressive is that the Knicks were able to sustain that level of shooting in the Finals against one of the league’s most respected defenses in the Spurs—led by reigning Defensive Player of the Year Victor Wembanyama.
Defensively, the Knicks held their ground as well, limiting opponents to a 50% eFG—which is below league average.
Now moving on to TOV%, which measures how often a team turns the ball over relative to its possessions. It reflects how well a team protects the ball and avoids giving away scoring opportunities.
In the postseason, where intensity is high and defenses are tight, the Knicks have done a decent job of taking care of the ball. Although not exactly the best, they sit in the middle tier, ranking seventh out of 16 playoff teams with a TOV% of 12.3.
On the defensive end, they also did a good job of forcing turnovers, ranking eighth among 16 playoff teams with an opponent TOV% of 13.5. They are also among the few teams with a positive turnover differential, meaning they force more turnovers than they commit.
But that was more than enough for the Knicks to handle the opponents they faced.
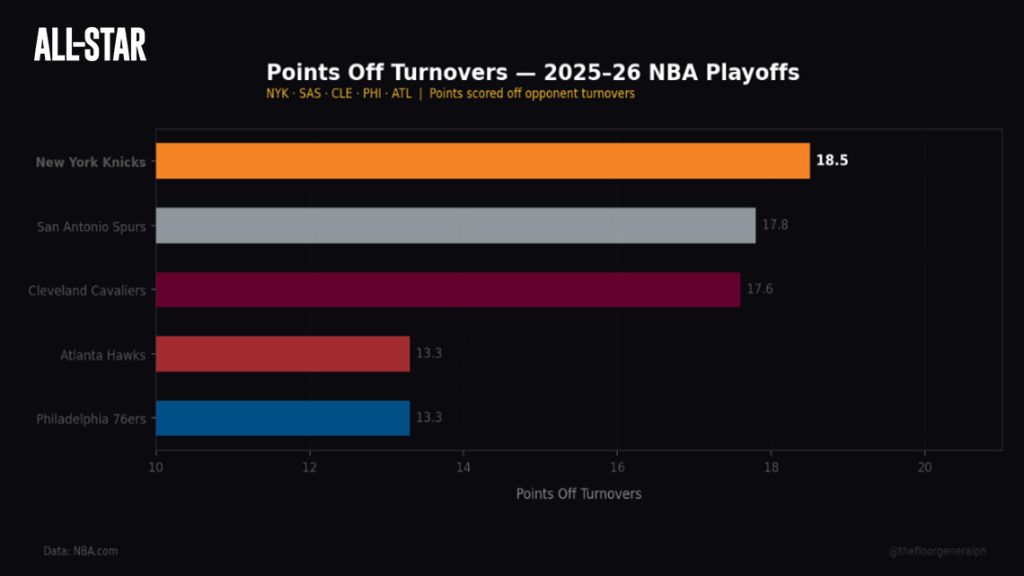
New York averaged 18.5 points off turnovers per game, outpacing the Spurs, the Cavaliers, the Hawks, and the 76ers in that category. Whenever an opportunity presented itself, they capitalized on it.
Next, rebounding. Using the metrics ORB% and DRB%, we can measure how well a team or player controls rebounds from different sides of the court.
ORB% is the share of available offensive rebounds a team grabs, showing how often they get extra possessions after a miss. DRB% measures the percentage of available defensive rebounds a team secures, reflecting how well they prevent opponents from earning second-chance opportunities after misses.
And the Knicks lacked neither in those departments.
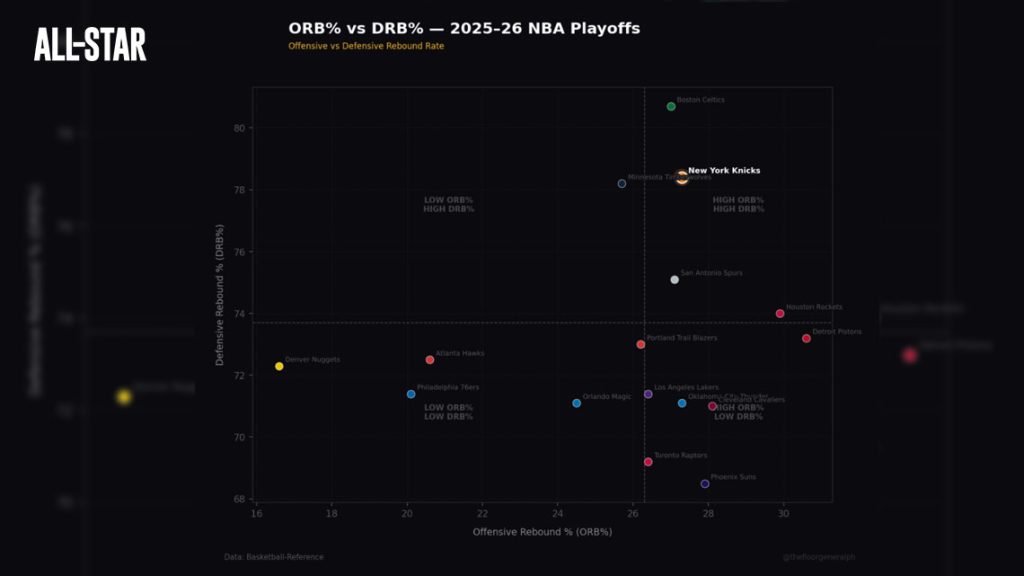
With a 78.4 DRB% and a 27.3% ORB%, both on the higher end of the chart, it is safe to say that the Knicks had little trouble controlling the glass.
This reflects the heart and hustle the team played with in controlling possessions, highlighted by Karl-Anthony Towns, Josh Hart, and Mitchell Robinson—who secured the championship-sealing offensive rebound in Game 5 of the Finals.
Overall, their collective effort ultimately overpowered even the league leader in total playoff rebounds, 7-foot-4 Wembanyama.
Lastly, free throws. FTRate measures how often a team gets to the free-throw line relative to its field goal attempts. In other words, it reflects a team’s ability to draw fouls and generate easy scoring opportunities at the charity stripe.
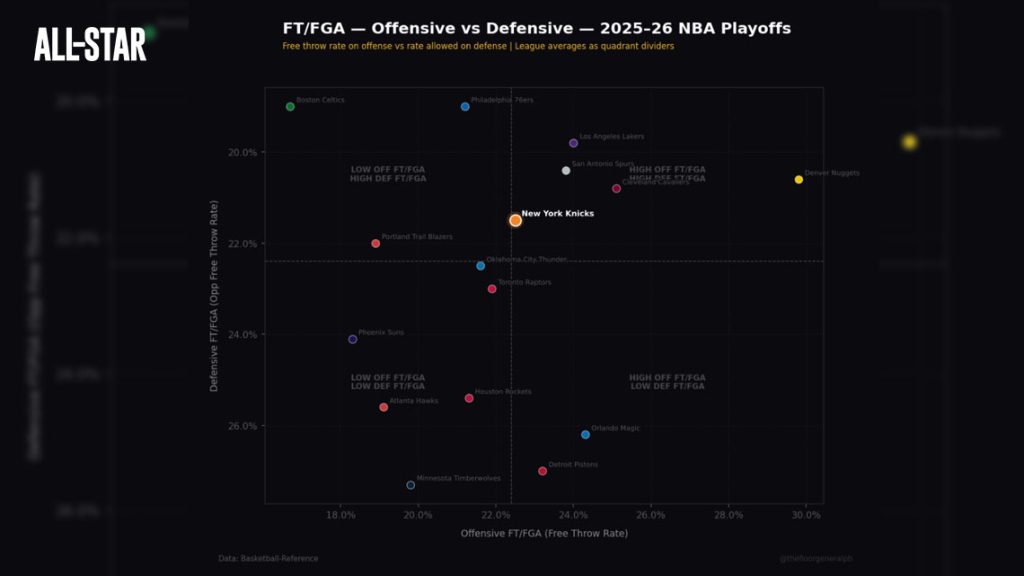
Although not the most eye-catching results, the graph shows that New York does not rely heavily on getting to the free-throw line for scoring, though they still generated a respectable amount of attempts with a 23% FTRate, right around the league average.
Defensively, they also did a solid job of keeping opponents off the line, allowing just a 22% FTRate, which is slightly better than average.
All in all, it is safe to say that the Knicks checked all four factors, a testament to just how complete and dominant this New York team was throughout the postseason.
Comeback Magicians
For everyone else, a double-digit lead is a comfort zone, especially in the fourth quarter. Against the Knicks, it’s the opposite—it’s where they take control.
Every one of these games ended the same way–a Knicks victory.
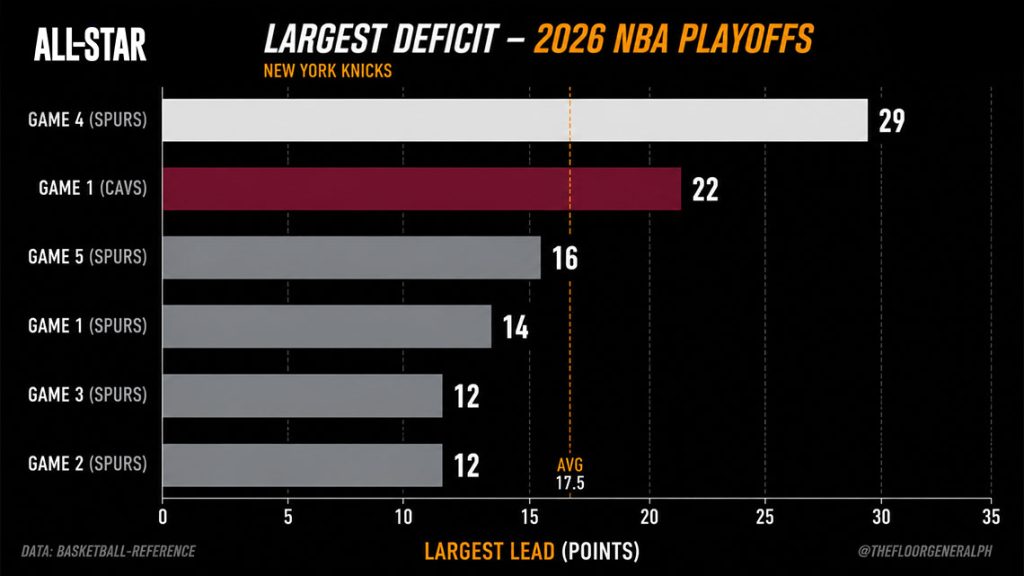
On average, the Knicks erased a deficit of 17.5 points in each of their comeback victories, an embodiment of the resilience that defined their championship run.
The first major test came in Game 1 of the Eastern Conference Finals. Trailing by as many as 22 points with less than eight minutes remaining, New York appeared headed for a crushing defeat.
Instead, the Knicks mounted one of the most remarkable comebacks in NBA playoff history, storming back behind Jalen Brunson’s relentless shot creation and forcing overtime before securing a 115–104 victory.
Brunson finished with 38 points and scored the game-tying basket with 19 seconds left in regulation. The comeback was even more stunning considering Cleveland had entered the night with a 40–1 record when leading by at least 15 points. Rather than stealing momentum, the Cavaliers watched the Knicks seize control of the series in dramatic fashion.
The Finals presented an even greater challenge. The Knicks fell behind by double digits in all five games against the Spurs and lost every first quarter, trailing by a combined 57 points across the series. Still, no matter how often they started slow, they kept finding ways to drag games back into reach and make them uncomfortable for San Antonio.
Game 4 became the defining moment of the series, as New York erased a 29-point deficit to steal a pivotal win. What looked like a blowout early on turned into one of the most unforgettable comebacks in NBA postseason history, as the Knicks refused to fold and clawed their way back possession by possession.
New York chipped away with tougher defense, smarter rotations, and steadier half-court execution, while Jalen Brunson once again carried the offense with timely buckets, controlling the tempo as the rest of the roster fed off the shift in momentum.
By the fourth quarter, the game had fully flipped. A 32–11 closing run sealed it, overwhelming San Antonio on both ends and turning a lost cause into a statement win that tied for the second-largest comeback in the play-by-play era and the biggest ever in the NBA Finals.
Game 5 followed the same pattern, with the Spurs again building a 16-point lead before New York gradually closed the gap, cutting it to five by halftime and setting up another familiar finish.
In the fourth quarter of Game 5, the déjà vu became unavoidable. San Antonio had answers early, but not enough to withstand another sustained Knicks surge, highlighted by a 10–0 run that tied the game at 83.
From there, the Spurs never fully regained control, as Jalen Brunson closed the door with poise and precision, guiding New York through yet another comeback and ultimately sealing the championship in the same relentless fashion that had defined the entire series.
What makes this so impressive is how completely they defied the odds. To put it into perspective, these were the win probabilities ESPN Analytics gave them in those games.
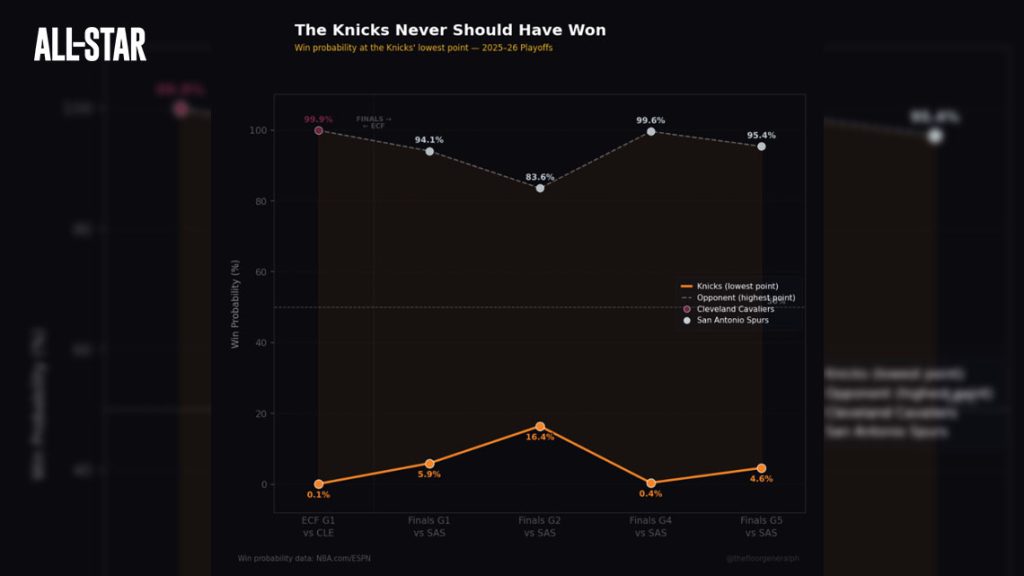
What once seemed impossible, the Knicks turned into reality.
Teamwork makes the Dream Work
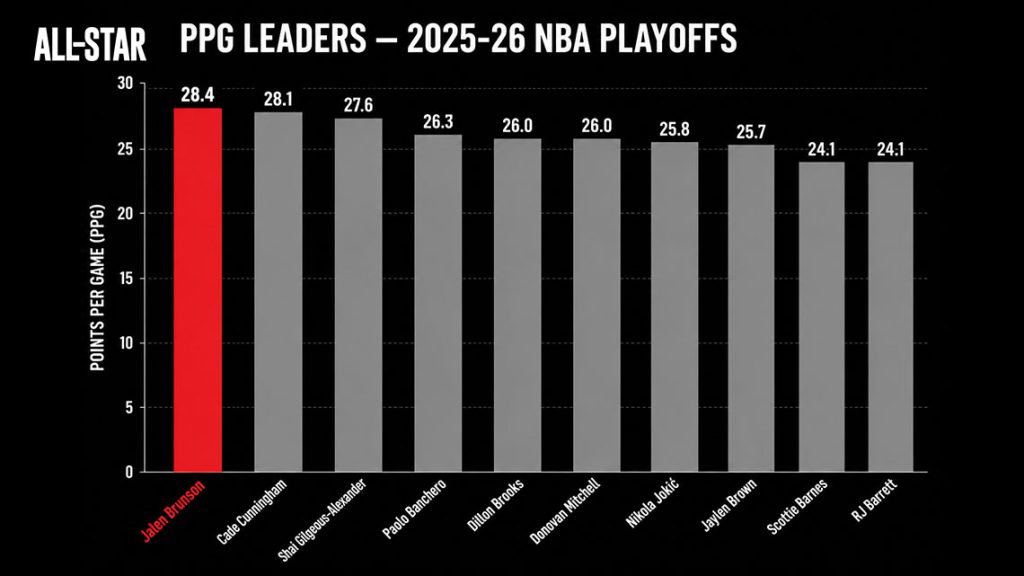
We all know Jalen Brunson is the head of the snake for the New York Knicks. He’s the Finals MVP and called Captain Clutch for a reason. In fact, he led all scorers this playoffs, averaging 28.4 points per game.
But this Knicks’ performance goes far beyond a single player—it is a collective effort.
Using a stat called Daily Plus/Minus (DPM), which is a predictive impact metric that combines box score production and plus-minus data, four Knicks players rank inside the top 15 this playoffs—underscoring the depth and balance driving their championship run.
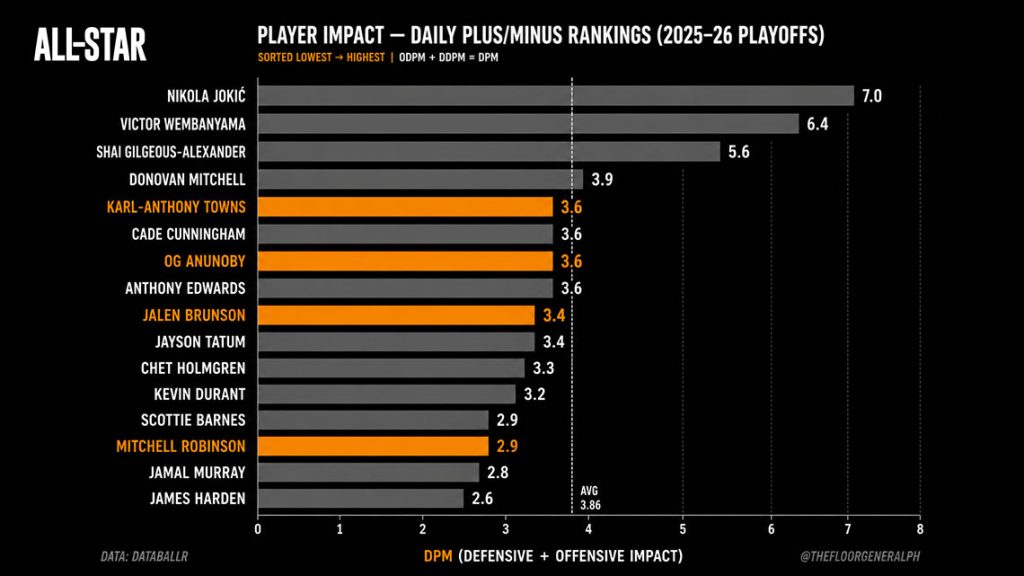
Towns and Anunoby’s impact has been off the charts this playoffs. It feels like every minute they’re on the floor, good things follow for New York.
Both are producing at an elite level—Karl-Anthony Towns averaging 15.9 points, 10.6 rebounds, 4.9 assists, 1.3 steals, and 1.3 blocks, while OG Anunoby is putting up 20.1 points, 6.3 rebounds, 1.6 assists, 1.5 steals, and 1.1 blocks.
But what’s extraordinary about them is their efficiency.
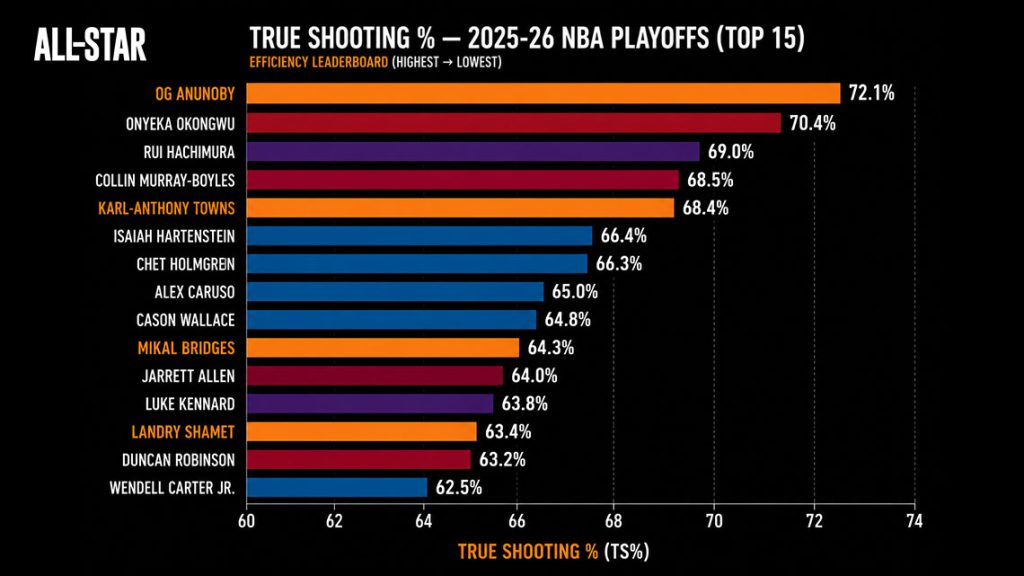
OG leads the playoffs in True Shooting Percentage (TS%), shooting 72.1 TS%. KAT is right there at an elite level as well, putting up a 68.4 TS%. The Knicks have been shooting lights out that even Mikal Bridges and Landry Shamet are getting in on the action, shooting 64.3% and 63.4 TS% respectively.
And for rebounding, New York doesn’t miss too.
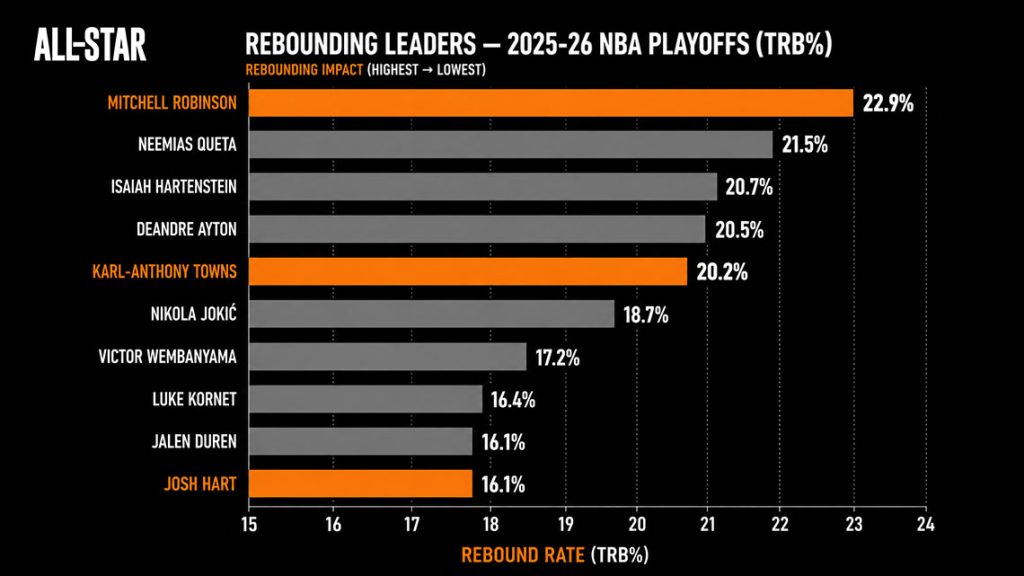
Mitchell Robinson has been a monster on the boards, leading all players in the playoffs with a total rebounding rate of 22.9 TRB%. That means he’s grabbing 22.9% of all available rebounds while he’s on the floor, which also helps explain why his DPM grades out so highly.
Towns is right there in the top 10 as well at 20.2 TRB%, while Josh Hart—the smallest player in that group—finds himself in the mix too, holding his own among the league’s elite rebounders.
To put everything into perspective, here’s how the Knicks’ production was distributed across the roster, showcasing the team effort behind their success.
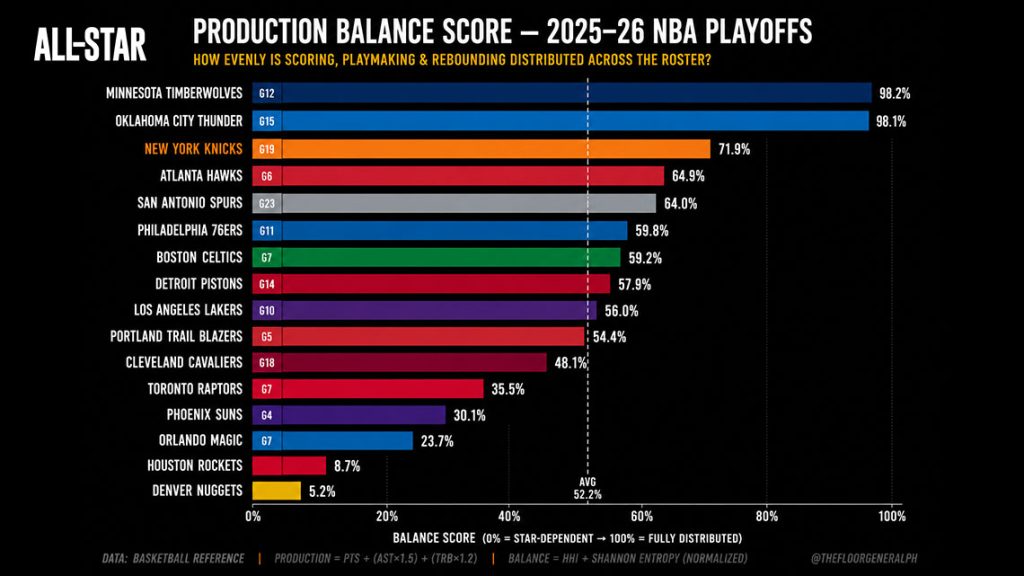
Using a production score formula where each player’s scoring, playmaking, and rebounding totals are weighted and combined — then measured for how evenly that output is shared across the roster — we can quantify which teams win through collective effort versus individual brilliance.
With the Knicks ranking third overall in that metric, it reinforces the point that their success is built on balance rather than reliance on a single star.
Jalen Brunson may lead the way, but he doesn’t dominate the offense to the exclusion of everyone else. Karl-Anthony Towns, OG Anunoby, Mikal Bridges, and Josh Hart all shoulder significant responsibilities. Even if opponents manage to contain Brunson, New York still has multiple players capable of making them pay.
This makes Knicks like the basketball version of a band where the lead singer is great, but the drummer, bassist, and guitarist could each headline their own show on a given night.
Conclusion
In the end, the Knicks’ championship run wasn’t defined by a single storyline, statistic, or superstar performance—it was defined by how all of it came together at once.
The dominance in net rating, the efficiency on both ends of the floor, the discipline in the Four Factors, the relentless rebounding, and the constant ability to overturn double-digit deficits all point to the same conclusion: this was a team built to control every phase of the game.
What makes this run stand out is not just that New York won, but how consistently they imposed their identity regardless of situation, opponent, or deficit.
Whether it was Brunson carrying late-game possessions, Towns and Anunoby providing two-way stability, or the supporting cast filling every statistical gap, the Knicks never relied on one answer—they had multiple. That depth, balance, and execution turned moments of pressure into moments of control.
And so, when the final buzzer sounded on a 53-year wait for a championship, it didn’t feel like an anomaly or a surprise run. It felt like the culmination of a team that, possession by possession, had already proven exactly who they were long before the trophy was lifted.
